Our first time …

Since the BILT Academy has been created and shaped a lot of new things came up that we needed to think of, which keeps us busy. Organizing a conference, creating an online platform with up to date technologies, getting public on social media are just some of the new tasks since October. All this makes a lot of fun but one task needs to be specially highlighted- reviewing all submitted abstracts for BILT 18.

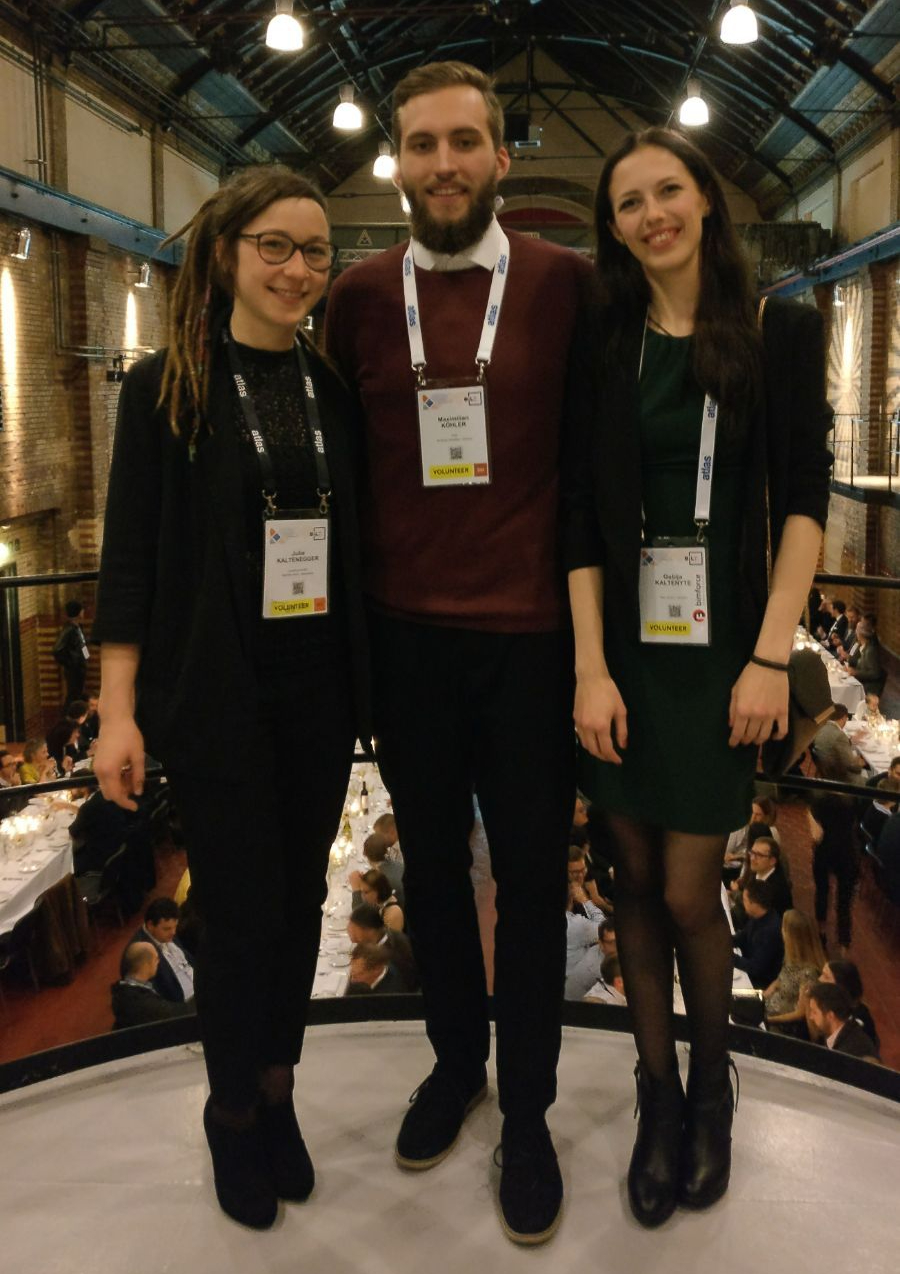
The three of us are a part of the BILT Europe Committee. Together we are one vote out of five in total for Europe. This does not only honor us but also allows us to get a deep insight of the organization behind the conference program. It is exciting to see how much effort and work is behind the selection of an appropriate program. In this blog, I would like to show you how this works and how it will be executed.

First of all, there is the Call for Abstracts, which allows all enthusiastic and ambitious people within the building industry and all around the field to submit papers of their expertise. Multi- and interdisciplinary topics within the AEC industry, facility and construction management and MEP planning are only a few of these. But how does an abstract look like?

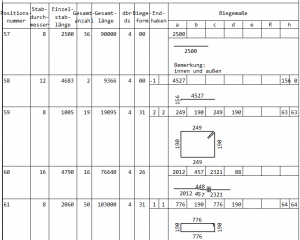
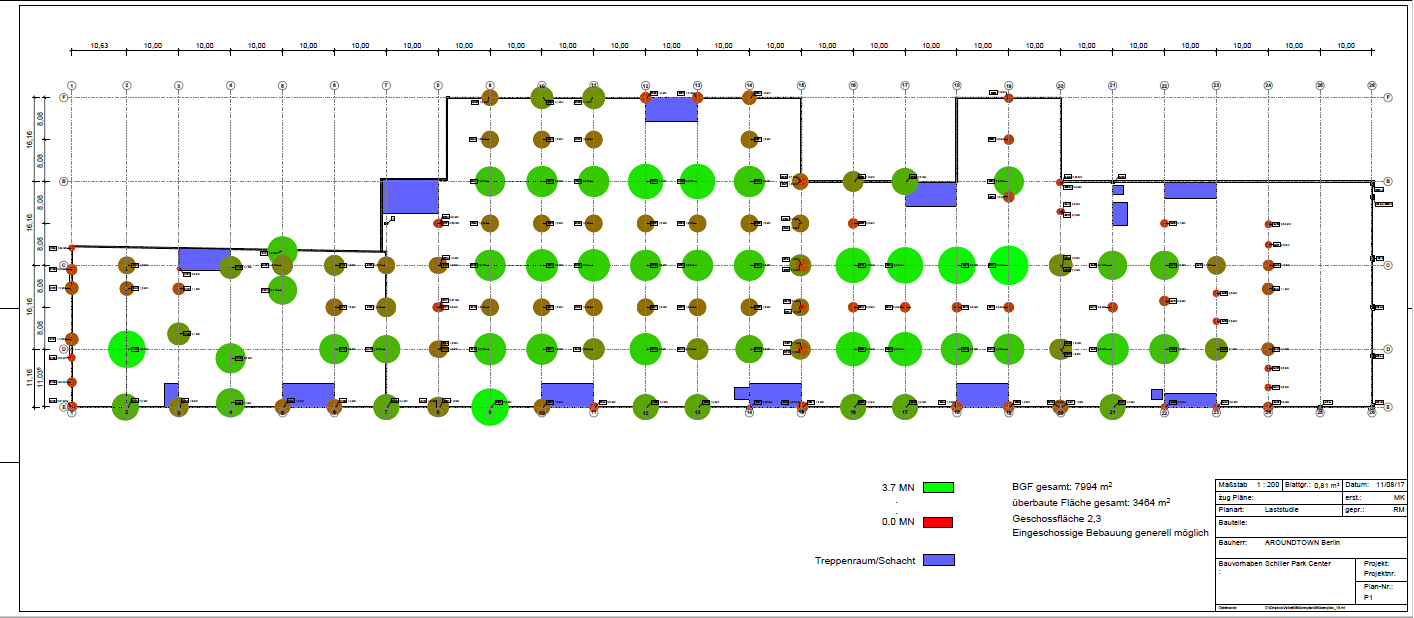
Basically, you have three different kinds. A 75 min presentation, a 75 min roundtable and a 75(x2) min lab. Furthermore, you need to categorize your topic in four main tags, from primary tag to software tag. Examples are Model Management, Next Generation, Programming and Coding, Architecture etc. The categorization helps us, the committee, already to outline the topic and to get a first impression what it is about. The main abstract body is the most important part- within around 500 words you can explain how your class would look like. All committee members need to vote on the originality and quality of the content. Personally, this is the most interesting part for me. Eight people, Eight different opinions, Eight different backgrounds packed in five voices are voting over approximately 180 abstracts. This is not only a small hell of a job but also an extreme responsibility beyond current industry out there. With this, we are shaping the entire program for around 400 people conference with the main purpose of connecting, collaborating and exchanging.

The next steps will be a call within the Academy. Since we were dividing all abstracts by the three of us, it becomes more efficient and inevitably necessary to talk it out. Which abstract impresses us at most, which disappoints us? To decide which abstract we take as our “holy cow” and also to exchange abstract´s, in case we did not understand the topic. To analyze our internal outcome of the review/voting we documented all this ID´s, titles plus our personal comments. Merlin, our Manager, is going to make a report to visualize our understanding of the topics. The aim behind all this is to understand what is relevant to nowadays technology and field and comparing it to universities curriculums in Europe to see what education lacks the most. I think this can illustrate not only where the strengths are, but also weakness in our education.

I am really looking forward seeing an analysis or statistics which compares the votings plus the comments we gave. I think it will be quite obvious to see which one came out of the corner from the BILT Academy. 😉

The mighty Dynamo Forum

Don’t reinvent the wheel. If you are trying to solve a problem, which can occur in multiple disciplines then it may be usefull to search through the Dynamo forum. Here is an example:

At my office we use SOFiSTiK Reinforcement add-in for Revit, because it automises many tasks. However, schedule all the rebars and fabric sheets can be quite difficult. The schedule function gathers all rebars which are assigned to one sheet. Therefore if you want to group all the rebars of level 1,.. into one schedule (because of estimation reasons), then you will probably loose the overview of all the rebar marks and compenents where they are part of.

So I searched Google for a solution to this and I found this link which is worth a mint: Dynamo forum link. This Dynamo graph will apply to all of your elements the sheet, where they are included. This. is. huge.

You can use this workflow to filter elements by GetParameterBy… afterwards. You can request it for example if all the rebars contains at least two sheets (one sheet where the whole level is shown, one for the component where they are part of).

Refurbishment projects with focus in structural engineering. Visualization of column’s load-bearing capacity

Sometimes it is all about to presenting data in an easily understandable way. Especially when the project hasn’t started yet and you have to present the advantages offered by your office. So my boss came up to me and asked me if I can accomplish a visualization task.
We have a refurbishment project (no digital data available like BIM models, plans,..) and I modeled every column with it’s belonging load-bearing capacity. The load-bearing capacity is the entry of the “comments” property of each object.

column

At first, I thought about to draw isolines of a capacity-surface but it takes too long to compute the surface. I asked Jostein Berger Olsen (http://jbdynamo.blogspot.de/) for his help and he came up with a much smarter idea. He edited my script in a way that circles would be drawn and the properties (like radius and color) depends on the load-bearing capacity. Let’s break down the whole task into some specific subtasks.

  1. Extract all the “comments” data out of each column
  2. As you can see, we have this weird way in Germany to express a decimal digit. Therefore I have to extract the string, erase the last 3 letters (whitespace+”MN”), change the “,” to a “.” and parse the string to a float/double type.
  3. If there is no entry, set the capacity to almost zero.
  4. Creating circles, where the middle points are the middle point of each column and the radius is the capacity of each column.
  5. Create a color range where the range is the normed range of our capacity (use of the Math.RemapRange)
  6. Overwrite the visibility of the circles with the belonging color-range-list.

So that’s it!
Here we have the result:

The python script:

dynamo python

And finally the result:

resultresult2


May we introduce … BILT Academy

WhatsApp Image 2017-10-07 at 19.47.39


We are BILT Academy a non-profit organization with a mission to shape the future experts of the building industry. Our aim of this blog is to focus on the technological part of the Architecture, Engineering and Construction fields.

Together with our mother organization BILT and RTC, carefully selected mentors and students, we want to provide you with tips, tricks, workarounds, workflows and latest news, interviews, and last but not least- to answer your questions.

So, what topics will we cover and how often should you check our blog?

Our blog is going to be updated weekly covering these topics:

  • General
  • Architecture
  • Coding, Content and Customisation
  • Computation Design
  • Estimation
  • Model Management
  • Operations and Maintenance
  • Simulation and Analysis
  • Structure
  • Visualisation

Why are we doing it?

We want to ensure that the next generation of professionals have a place to update themselves with technology news and to have a sense of the community they are about to enter.

We would like to invite YOU to be a part of the community!